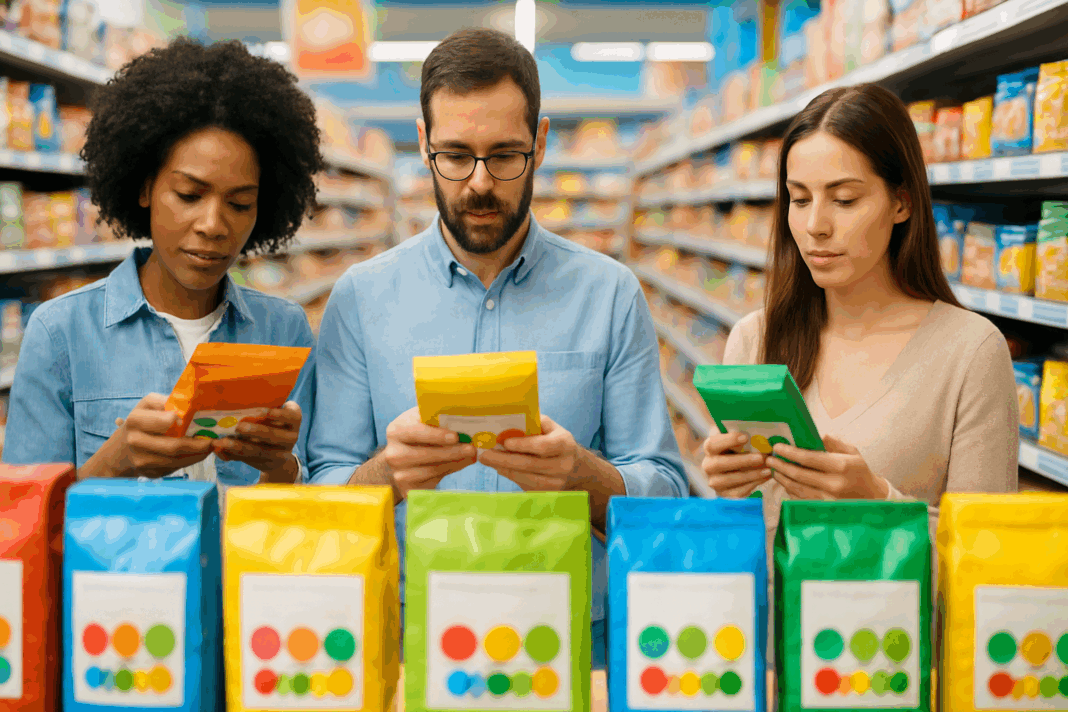
In an age where dietary decisions are increasingly shaped by the pursuit of longevity, disease prevention, and optimized performance, the food label stands as a nutritional compass. Yet, while many consumers glance at calories or sugar content, few delve into the most transformative element on that label: the daily value food picture. This visual representation, commonly referred to as the daily value pic, is far more than a cluster of numbers and percentages. It is a strategic guide designed to help individuals understand how a specific food product fits into the context of a healthy daily diet.
You may also like: 4 Ways to Have a Healthy Diet: Expert Tips Backed by Science for Better Nutrition and Long-Term Wellness
Understanding how to interpret a daily value food picture is not just a matter of curiosity; it is a skill grounded in science that empowers consumers to make more informed, deliberate, and health-affirming dietary choices. Whether you are managing your sodium intake for cardiovascular health, balancing macronutrients to maintain energy, or optimizing micronutrient intake for cognitive function, this nutritional snapshot holds the key. As we unfold the layers of what each daily value pic communicates, the goal is to equip you with a comprehensive, evidence-based understanding of how to use this information effectively and responsibly.
Decoding the Purpose and Design of a Daily Value Food Picture
At its core, the daily value food picture serves a dual function: education and regulation. Created under the auspices of the U.S. Food and Drug Administration (FDA), it is intended to provide consumers with an at-a-glance assessment of how a particular food item contributes to the recommended daily intake of essential nutrients. The design of the daily value pic is intentionally visual and percentage-based to ensure accessibility across varying levels of nutritional literacy. It draws upon the concept of the Daily Value (DV), a benchmark derived from scientific consensus on nutrient requirements based on a 2,000-calorie diet.
Each daily value food picture visually maps out the nutrient profile of a product, listing figures such as grams of fiber, saturated fat, added sugars, protein, sodium, calcium, iron, and other key nutrients. These numbers are then translated into percentages, indicating what portion of the DV is provided by a single serving of the product. The design prioritizes clarity and quick reference, which is essential in environments such as grocery stores where consumers often make decisions in seconds. Thus, the daily value pic functions as a bridge between complex nutritional science and everyday consumer decision-making.
Interpreting Percent Daily Values in Context
While the numbers in a daily value pic may appear straightforward, interpreting them requires a nuanced understanding of nutritional needs. A common misconception is that 100% DV is a fixed target for all nutrients; in reality, it is more of a general guideline. Some nutrients, such as dietary fiber, calcium, and vitamin D, are often under-consumed, making it desirable to reach or exceed the 100% DV over the course of a day. Conversely, for nutrients like saturated fat, sodium, and added sugars, the goal is to remain below 100% to reduce the risk of chronic diseases.
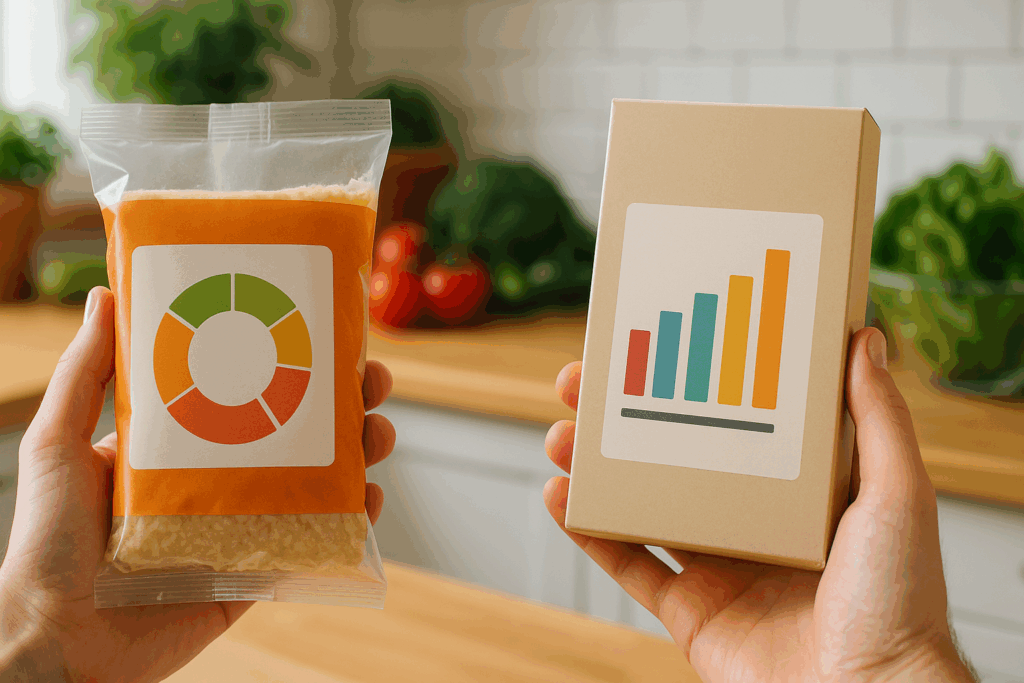
Context is also essential when comparing products. For example, a granola bar may show 10% DV of added sugars per serving, which may seem acceptable until you consider how many servings you consume or how that fits within your total dietary intake. The daily value food picture offers a percentage, but it is the consumer’s responsibility to translate that percentage into meaningful choices within the framework of their entire diet. Understanding how to compare multiple daily value pics side by side is particularly useful when choosing between brands or preparing meals with multiple packaged ingredients.
Macronutrients and the Role of Daily Value Percentages
Macronutrients—carbohydrates, protein, and fat—play a foundational role in human health, energy production, and physiological repair. The daily value pic includes these components, but interpreting their relevance depends on individual health goals. For someone aiming for weight loss, total fat and carbohydrate percentages may be closely monitored, while someone pursuing muscle gain might prioritize protein content.
Each macronutrient also includes subcategories that carry their own health implications. For example, under fat, you will often find saturated and trans fats listed separately. A daily value pic might indicate that a single serving of a product contains 20% of the DV for saturated fat. In such a case, consuming multiple servings could quickly push intake levels into a range associated with increased cardiovascular risk. Similarly, carbohydrate listings often include fiber and added sugars, which provide insight into both the quality and source of the carbohydrate content. Evaluating these distinctions within the daily value pic provides a richer understanding of a food product’s macronutrient profile.
Micronutrients and Their Hidden Significance
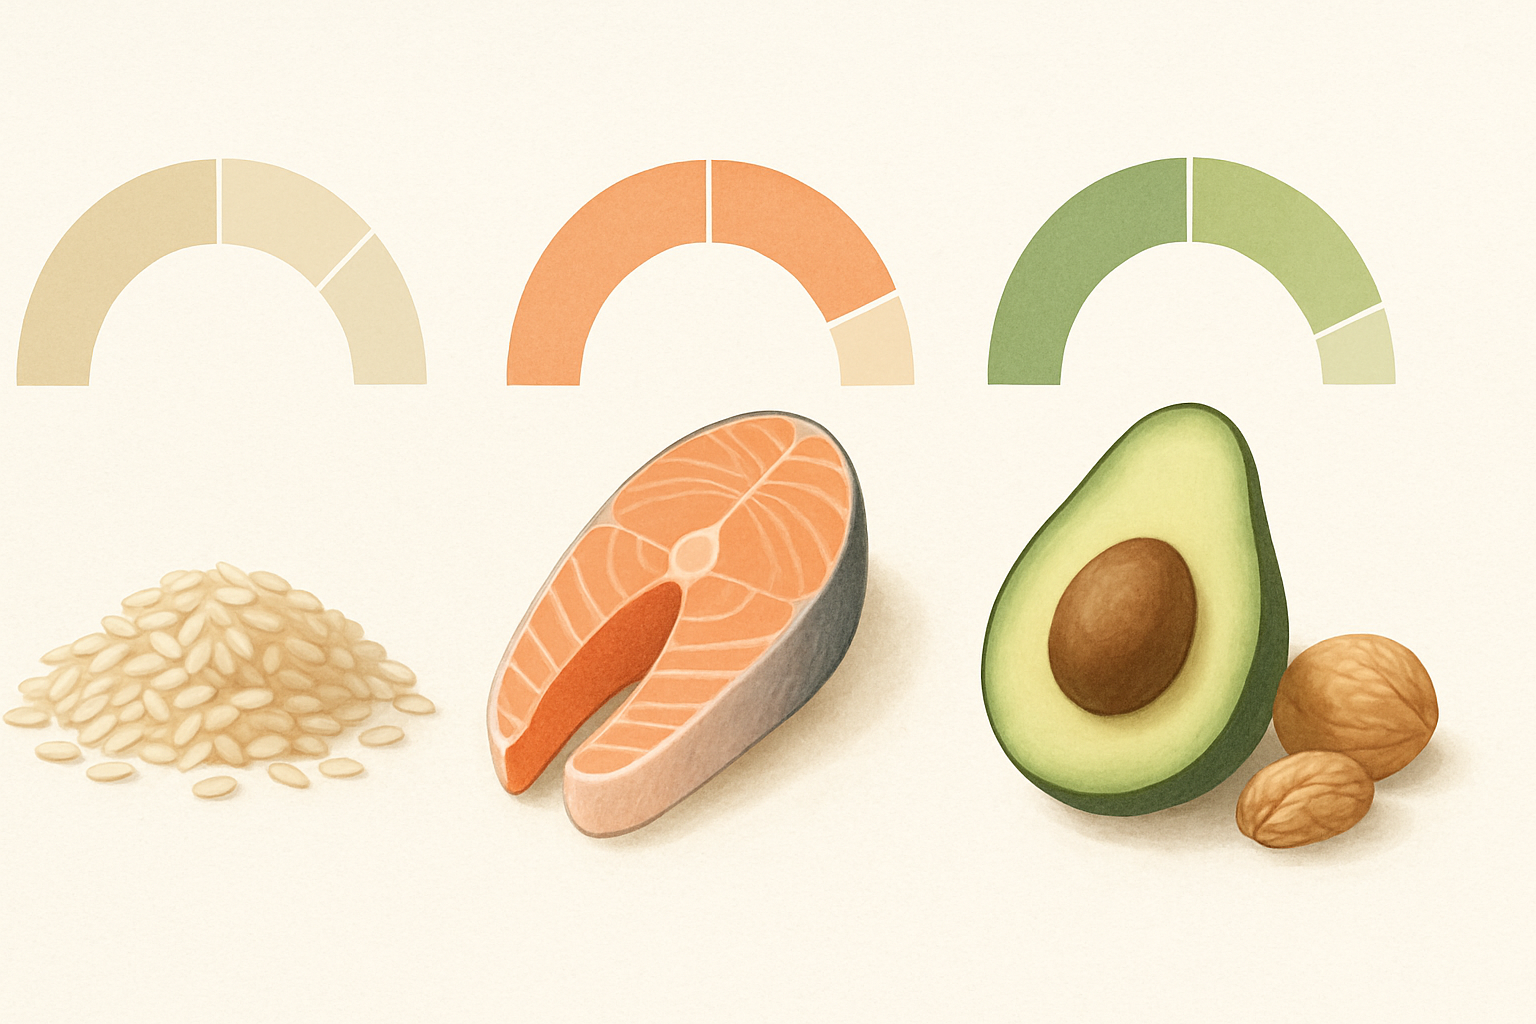
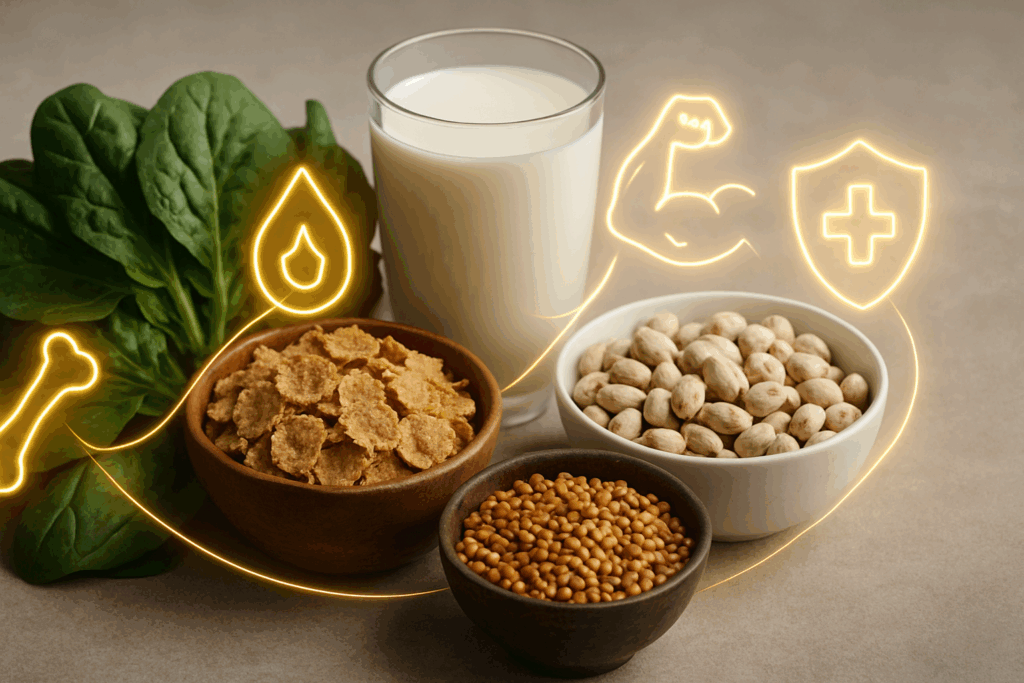
Micronutrients are often overlooked in casual label reading, but their inclusion in the daily value food picture is critical. Nutrients such as calcium, iron, potassium, and vitamin D are highlighted because of their significant roles in bone health, blood production, muscle function, and immune support. A common challenge in modern diets is the underconsumption of these key vitamins and minerals, which can lead to subtle yet impactful health issues over time.
Interpreting the daily value pic allows for a proactive approach to addressing potential nutrient gaps. For example, if a person with low iron levels is choosing between cereals, a product showing 90% DV of iron per serving may be particularly beneficial. Likewise, foods that contribute significantly to calcium and vitamin D intake can be essential for older adults concerned about osteoporosis. By giving visibility to these micronutrients, the daily value food picture helps consumers construct a diet that supports not just general health, but also specific physiological functions and life-stage requirements.
Reading Between the Lines: Serving Size and Total Intake
One of the most critical, yet frequently misunderstood, elements of the daily value pic is the concept of serving size. All nutritional values provided are based on a single serving, but that serving may not reflect what individuals actually consume in one sitting. If a package contains two servings and you consume the whole package, you must double the listed percentages to get an accurate picture of your intake.
This simple misunderstanding can lead to significant discrepancies in nutrient consumption, particularly for nutrients that should be limited. For example, a serving of chips may contain 15% of the DV for sodium, but if you eat two or three servings, that total escalates rapidly. Being able to interpret serving size within the context of the daily value food picture equips consumers with the foresight to adjust portion sizes or select alternative products. It also reinforces the value of mindful eating and portion awareness, both of which are essential for maintaining nutritional balance.
How Daily Value Pics Support Special Diets and Medical Conditions
For individuals managing specific health conditions, the daily value food picture becomes even more essential. Those with hypertension must pay close attention to sodium intake, while individuals with diabetes often monitor total and added sugars. A product that provides 5% DV of sodium per serving may be a better option than one offering 20%, depending on daily sodium allowances recommended by healthcare professionals.
Similarly, individuals adhering to therapeutic diets such as low-phosphorus regimens for kidney disease or high-fiber diets for gastrointestinal health can use daily value pics to tailor their food choices. The beauty of the daily value food picture is that it can be adapted to meet diverse dietary needs. When interpreted through the lens of a medical condition, each daily value pic becomes a tool not just for nutrition, but for disease management and health preservation.
Integrating Daily Value Pics into Meal Planning
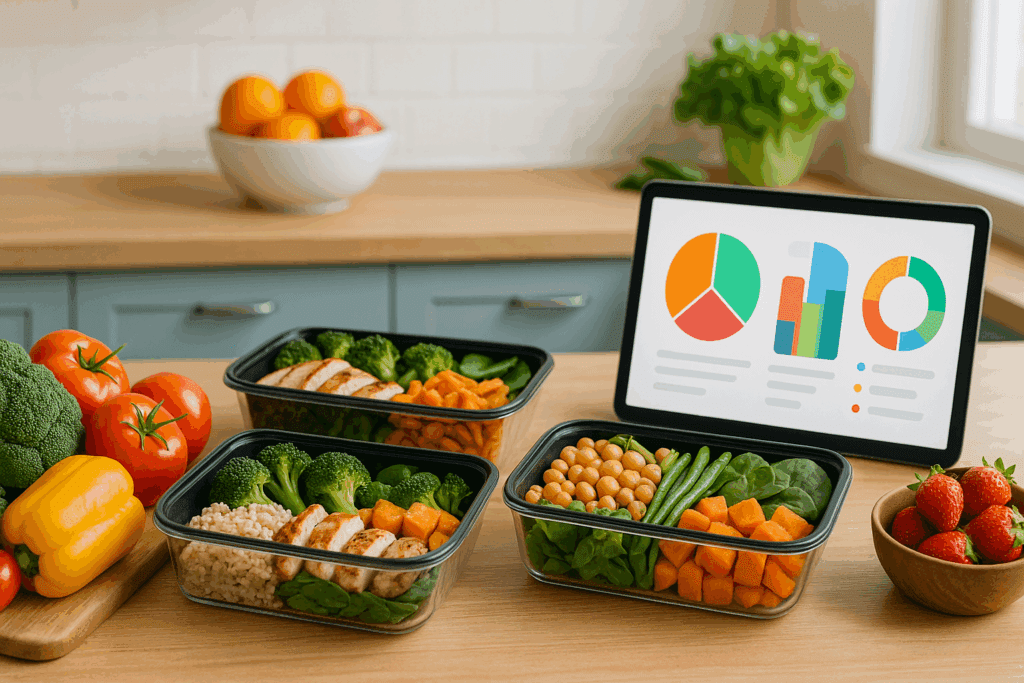
Understanding the data in a daily value food picture is only the first step; the next is using that information to build a balanced diet. By reviewing daily value pics across the foods you consume throughout the day, you can identify excesses or deficiencies in your nutrient intake. For example, if your breakfast cereal covers 40% of the DV for fiber and your lunch salad adds another 30%, you’re well on your way to meeting your daily goal.
This holistic view of nutrient consumption makes the daily value pic an ideal tool for meal planning. It allows you to strategically choose foods that complement each other nutritionally. If your dinner entree is low in potassium, you might choose a side rich in leafy greens or sweet potatoes to balance it out. Over time, this approach promotes not only nutritional adequacy but also variety, which is a cornerstone of long-term dietary health. The more fluent you become in interpreting and applying daily value pics, the more empowered you are to take charge of your health through food.
Common Misinterpretations and How to Avoid Them
Despite the clarity of a daily value food picture, misinterpretations still occur. One common mistake is assuming that a higher percentage always indicates a healthier choice. While this may be true for fiber or vitamin D, it is certainly not for added sugars or saturated fats. Another issue is the tendency to overlook nutrients that are not listed, such as magnesium or omega-3 fatty acids, which are also important for health but may not appear in every daily value pic.
Additionally, consumers often confuse “% Daily Value” with the absolute amount needed by their individual body. A food that offers 25% DV of protein might be more or less suitable depending on your weight, age, sex, and activity level. Avoiding these pitfalls requires a deeper understanding of nutrition science and, where necessary, consultation with a healthcare provider. Educating yourself about the intricacies of the daily value food picture transforms it from a passive label into an active guide for smarter eating.
Building Long-Term Health Literacy with Daily Value Pics
The ultimate value of understanding the daily value pic lies in its capacity to build health literacy. When consumers know how to read and interpret this visual tool, they become less susceptible to misleading health claims and more capable of making truly informed decisions. Over time, this knowledge fosters habits that can significantly reduce the risk of diet-related conditions such as obesity, cardiovascular disease, and type 2 diabetes.
Moreover, health literacy extends beyond individual benefit. Parents who understand daily value pics can model healthy eating for their children. Teachers can incorporate label literacy into science or health classes. Employers can use this knowledge to create healthier workplace environments. In this sense, the daily value food picture is not just a tool for individual health, but a catalyst for broader public health improvements.
Frequently Asked Questions: How to Read a Daily Value Food Picture
1. How can I use a daily value food picture to support intermittent fasting or time-restricted eating?
A daily value food picture is an excellent tool for individuals following intermittent fasting or timerestricted eating plans because it helps maximize nutrient intake during condensed eating windows. When you’re limited to eating within 8 hours or fewer, it’s essential that your meals are rich in fiber, protein, and micronutrients. The daily value pic makes it easy to identify foods that pack a nutritional punch per serving, enabling you to hit your daily targets efficiently. For example, selecting a high-DV protein source and pairing it with vegetables high in potassium can help cover multiple nutrient bases in one sitting. By reviewing several daily value pics before meal prep, you can ensure your limited meals are still nutritionally complete and diverse.
2. Can a daily value pic help people with food sensitivities or allergies?
While the daily value pic does not directly list allergens, it can indirectly aid people with foodsensitivities in making smarter choices. Individuals with lactose intolerance, for instance, can use the calcium and vitamin D values in a daily value food picture to assess whether fortified non-dairy alternatives meet their nutritional needs. Those with gluten sensitivity might focus on fiber and iron percentages to compensate for nutrients lost when avoiding enriched wheat products. Reading daily value pics alongside the ingredient list allows for a fuller picture of nutritional adequacy, especially when dietary restrictions limit certain food categories. This dual-layered approach supports both safety and nutrient sufficiency in restricted diets.
3. What role does the daily value food picture play in understanding nutrient density versus calorie density?
The daily value food picture can help distinguish between nutrient-dense and calorie-dense foods, aconcept crucial for weight management and metabolic health. A nutrient-dense item provides high percentages of essential vitamins and minerals without excessive calories, while calorie-dense foods may supply lots of energy with few beneficial nutrients. For instance, a snack that delivers 25% DV of fiber and 15% DV of potassium per 150 calories is more nutritionally valuable than one offering 5% DV of iron and 2% DV of calcium at the same calorie level. By analyzing multiple daily value pics, consumers learn to prioritize options that deliver a greater nutrient return per calorie consumed. This strategy is particularly useful when trying to lose weight without compromising on essential nutrition.
4. How do daily value pics help those recovering from illness or surgery?
Recovery from illness or surgery places increased nutritional demands on the body, especially forprotein, iron, vitamin C, and zinc. A daily value food picture helps caregivers and patients identify packaged foods that support tissue repair, immune function, and overall resilience. For example, a post-operative patient can look for high-DV protein items or snacks with elevated vitamin C and iron to promote healing and reduce fatigue. In these scenarios, daily value pics can act as a nutritional checklist, ensuring each meal supports convalescence. Especially for patients with limited appetites or dietary constraints, using the daily value pic helps prioritize foods that offer concentrated support in smaller portions.
5. Are daily value food pictures useful for athletes and high-performance individuals?
Absolutely. Athletes and active individuals often require more calories and micronutrients than thegeneral population, and the daily value pic can help fine-tune their intake. While DV percentages are based on a standard 2,000-calorie diet, they provide a quick reference for ensuring that training meals contain adequate levels of key nutrients like magnesium, potassium, and B vitamins. When athletes combine several packaged items, comparing daily value pics enables them to strategically balance electrolytes and recover faster. Additionally, understanding which foods contribute significantly to muscle-supporting nutrients, like protein and iron, allows athletes to avoid over-reliance on supplements. In this way, the daily value food picture becomes a performance tool that integrates nutritional science into everyday eating.
6. How can the daily value pic promote more mindful snacking habits?
Snacking is one of the easiest opportunities to either support or derail your nutrition goals, and thedaily value food picture offers a practical way to assess snack quality. Many packaged snacks may seem healthy due to buzzwords like “natural” or “organic,” but the daily value pic reveals the truth about added sugars, sodium, and nutrient content. Choosing a snack with higher fiber and protein percentages while keeping sodium and added sugars low becomes a smarter and more satisfying option. This simple visual cue helps consumers pause and think about whether a snack is merely convenient or genuinely nourishing. Over time, consulting the daily value pic can shift habits toward more intentional and nutritionally strategic snacking.
7. Do daily value food pictures play a role in cultural or plant-based diets?
Yes, daily value pics are incredibly helpful when navigating culturally specific or plant-based diets. Forindividuals eating primarily whole foods, it may be challenging to determine if they’re meeting their daily requirements for nutrients like iron, calcium, or vitamin B12. Packaged products such as tofu, lentil-based snacks, or fortified plant milks often include a daily value food picture that shows how these items can fill potential nutrient gaps. For instance, a fortified almond milk might show 50% DV for calcium and 25% DV for vitamin D per serving, making it easier to substitute for dairy. By using the daily value pic, individuals following non-Western or plant-centered diets can fine-tune their intake while honoring cultural preferences or ethical commitments.
8. What innovations are emerging in how daily value pics are presented on packaging?
Recent innovations in nutrition labeling are making daily value food pictures even more accessible anduser-friendly. Some companies are integrating color-coded bars, smartphone-scannable QR codes, or infographic-style visuals alongside traditional daily value pics to offer real-time data and educational tips. There’s also a growing interest in dynamic labels that adjust based on consumer input—such as age, gender, and activity level—providing a more personalized interpretation of the daily value pic. These advancements aim to empower consumers through interactive technology, making nutrition education more engaging. As more consumers demand transparency and clarity, expect the daily value food picture to evolve into a more intelligent and responsive tool.
9. How can the daily value food picture support sustainable eating habits?
While the daily value food picture is focused on nutrient content, it can indirectly guide moresustainable eating choices. Foods with higher nutrient density often align with plant-forward eating, which has a lower environmental impact. For example, comparing a veggie-based frozen meal to a meat-heavy one may reveal that the plant-based option offers comparable protein and higher fiber at a lower saturated fat percentage. Using the daily value pic to evaluate such products encourages consumers to choose options that are not only better for health but also for the planet. Over time, this fosters an eating style that balances personal wellness with ecological responsibility.
10. Is there a psychological benefit to learning how to read daily value food pictures?
Yes, gaining fluency in reading daily value food pictures can have a powerful psychological impact. Itfosters a sense of agency and reduces anxiety around food choices by transforming the shopping experience into an informed, intentional act. Instead of feeling overwhelmed by conflicting marketing claims, individuals who understand the daily value pic can confidently choose products that align with their goals. This empowerment can improve overall mental well-being and create a more positive relationship with food. Furthermore, teaching this skill to children and adolescents can instill lifelong habits of nutritional awareness and self-care, making the daily value food picture a tool for mental as well as physical health.
Conclusion: Empowering Smarter Eating Through Daily Value Food Pictures
Learning to read a daily value food picture is more than a nutritional skill; it is a critical act of self-care in a world of complex food choices. With every daily value pic, you gain a clearer understanding of how your meals contribute to—or detract from—your overall well-being. When interpreted correctly, this tool reveals not only the nutrient density of individual foods but also the cumulative impact of dietary decisions over time.
By integrating the daily value food picture into your everyday choices, from the grocery store to your kitchen table, you take a proactive step toward better health. You become less reactive to food marketing and more aligned with evidence-based nutrition. Whether you’re aiming to boost your fiber intake, reduce added sugars, or achieve a balanced macronutrient profile, each daily value pic offers an immediate, actionable insight. In embracing this tool, you embrace your power to make food a consistent ally in your journey toward health and longevity.
Understanding how to interpret and apply the information in a daily value food picture helps demystify nutrition labels and transforms them into practical guides. As health professionals continue to emphasize preventive care and dietary quality, the ability to read and apply daily value pics becomes an essential component of personal health literacy. It is not merely about counting calories or meeting targets, but about engaging thoughtfully and knowledgeably with the foods we consume every day.
Further Reading:
Ultimate Guide to Reading Nutrition Labels Accurately
How to Understand and Use the Nutrition Facts Label
https://www.fda.gov/food/nutrition-facts-label/how-understand-and-use-nutrition-facts-label


